Advanced Market Metrics Guide: Open Interest, Funding Rates & Long-Short Ratios (2024)
Advanced Market Metrics Guide: Open Interest, Funding Rates & Long-Short Ratios (2024)
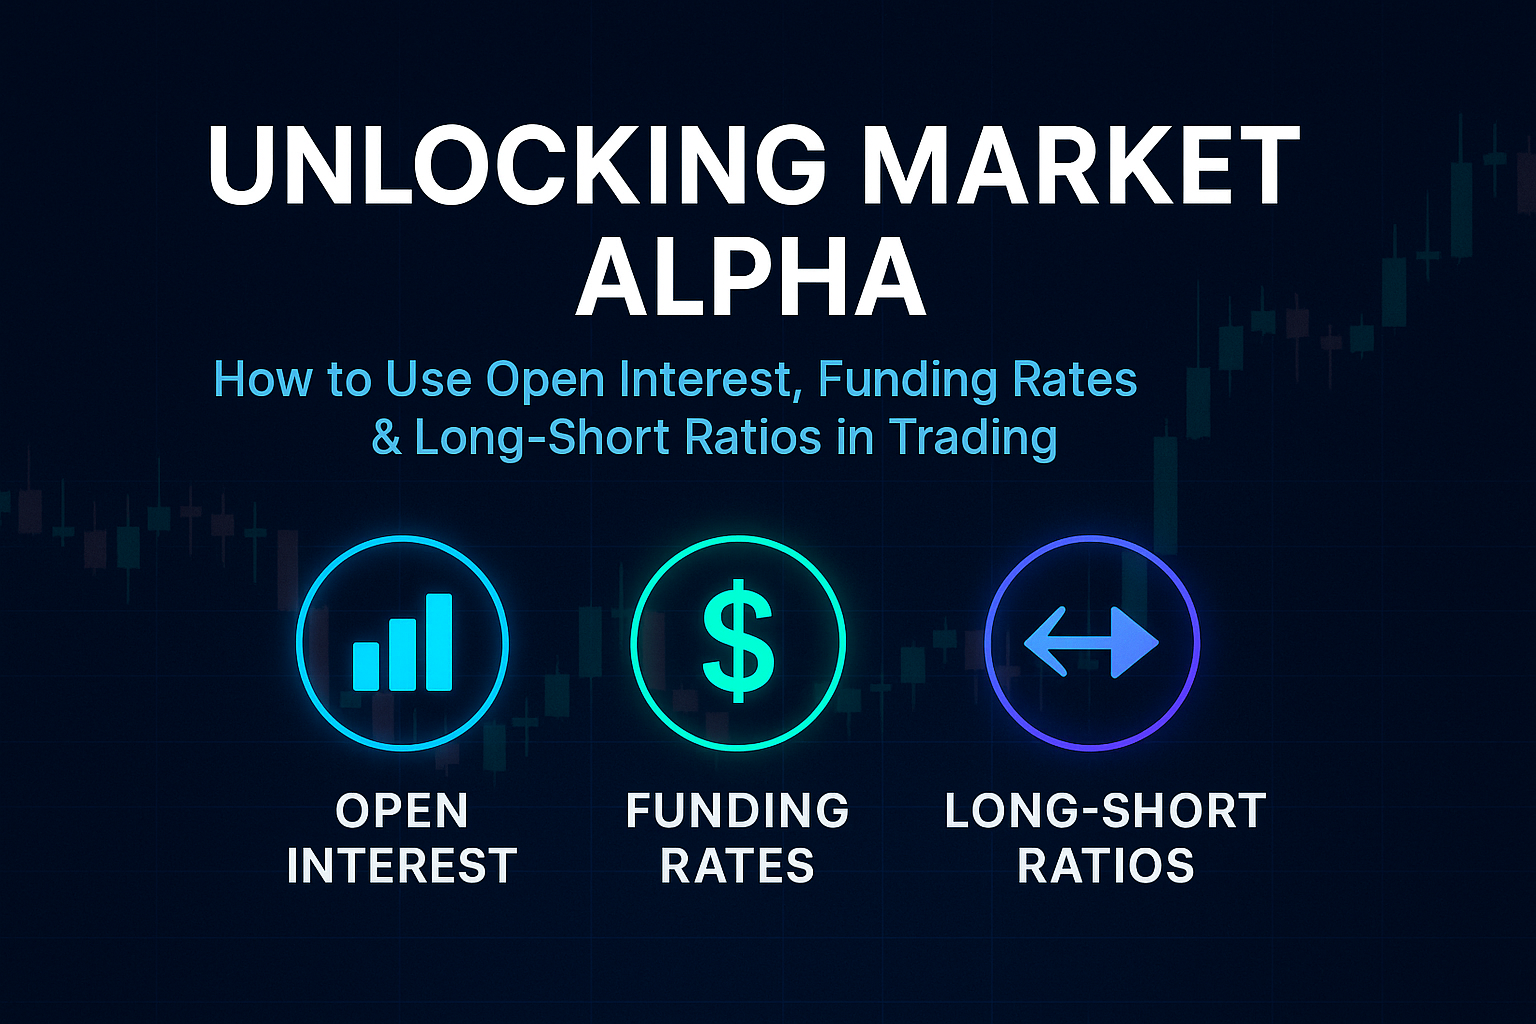
Discover how professional traders use Open Interest, Funding Rates, and Long-Short Ratios to gain a competitive edge in crypto futures trading. Learn to read market sentiment and predict major moves before they happen.
Every trader dreams of having an "edge" — that secret sauce that lets you anticipate the market's next move before the crowd catches on. While most retail traders focus solely on price action and charts, the most consistently profitable traders quietly monitor three obscure but powerful metrics: Open Interest, Funding Rates, and Long-Short Ratios.
These aren't just buzzwords you've seen on Twitter or crypto dashboards. Used correctly, they reveal the psychology of the market, the imbalance of risk, and where liquidity might be hiding. In this article, I'll break down exactly what they mean, how they work, where to find them, and how you can start using them today to strengthen your futures trading strategy.
Why These Metrics Matter
Price is just the surface. What drives price are the positions, leverage, and emotions of participants behind the scenes.
- Open Interest shows you where capital is locked in.
- Funding Rates expose which side is over-leveraged.
- Long-Short Ratios reveal herd behavior (and herd behavior is usually wrong at extremes).
Understanding these can give you a serious edge — like seeing the cards your opponent is holding at the poker table.
1. Open Interest (OI): The Market's Pulse
Definition: Open Interest is the total number of outstanding contracts (longs or shorts) that haven't been settled. Think of it as the measure of how much money is currently in the game.
How It Works:
- Rising OI with rising price → new money entering the market, trend confirmation.
- Rising OI with falling price → shorts entering aggressively, bearish conviction.
- Falling OI with rising price → short covering rally, not true bullish strength.
- Falling OI with falling price → longs being liquidated or closing, not sustainable bearishness.
Where to Find It:
- Bybit: Go to "Derivatives → Data" where Open Interest is tracked across contracts.
- Bitget: Their "Market Data" section provides OI charts for top futures pairs.
- Tools: Sites like Coinglass, Laevitas, and CryptoQuant aggregate OI across exchanges for a broader view.
Pro Tip: Watch for divergences. If Bitcoin pumps but OI drops sharply, it often means shorts are closing positions (not real buyers stepping in). That move might fade quickly.
2. Funding Rates: The Hidden Tax of Leverage
Definition: Funding rates are periodic payments exchanged between long and short traders in perpetual futures. They exist to keep the contract price anchored to the spot price.
- Positive funding rate: Longs pay shorts. The majority of traders are long.
- Negative funding rate: Shorts pay longs. The majority are short.
How It Works:
Funding rates act like a sentiment index of leveraged positions. When funding is extremely positive, it signals overcrowded longs — and historically, that's when the market is vulnerable to a sharp downside move. When funding is deeply negative, everyone is short, and it often sets the stage for a squeeze higher.
Where to Find It:
- Bybit: "Funding Rate" data is shown live in the contract details window.
- Bitget: Their futures dashboard updates funding every 8 hours.
- Tools: Coinglass is the go-to site for tracking funding rates across all major exchanges in real time.
Pro Tip: Instead of chasing the herd, think like a contrarian. If you see funding rates spiking positive while OI is climbing, ask yourself: Who is left to buy? That's when smart traders start looking for short entries.
3. Long-Short Ratios: Herd Psychology in Numbers
Definition: Long-Short Ratios measure the proportion of traders holding long positions versus shorts. Most exchanges publish this data, and while it isn't perfect, it gives a clear snapshot of retail positioning.
How It Works:
- A high long-short ratio → the crowd is overly bullish.
- A low ratio → the crowd is heavily bearish.
Where to Find It:
- Bybit: Under "Trading Data → Long/Short Ratio," updated frequently.
- Bitget: Shows trader sentiment ratios in their futures market data.
- Tools: Coinglass, Laevitas, and Binance Futures Data are excellent for cross-exchange comparison.
Example: If the long-short ratio is 75% long, OI is rising, and funding is strongly positive, you're looking at a very crowded long trade. Smart money often takes the opposite side.
Putting It All Together: A Trader's Playbook
Here's how seasoned traders combine these metrics to build edge:
Confirming Trend Strength
- Price rising + OI rising + neutral funding → strong bullish trend with real participation.
- Price rising + OI falling + positive funding → beware of a fake pump fueled by short squeezes.
Spotting Squeezes Before They Happen
- Negative funding + majority shorts (low long-short ratio) + rising OI → setup for a short squeeze.
- Positive funding + crowded longs + rising OI → setup for a long squeeze.
Risk Management
Extreme readings (like funding at 0.1%+ or long-short ratios above 70%) often signal unsustainable positioning. That's when professionals reduce exposure or look to fade the crowd.
Real-World Example: Catching the Squeeze
In mid-2023, Bitcoin hovered around $25k while funding turned deeply negative, OI climbed, and long-short ratios showed the majority of traders were short. What happened next? A brutal short squeeze drove BTC above $30k within days.
Traders who were watching price alone got blindsided. Those watching OI, funding, and ratios? They saw the powder keg building and positioned accordingly.
Final Thoughts: Start Thinking Like a Pro
The difference between average and elite traders isn't luck — it's perspective. Price tells part of the story, but metrics like Open Interest, Funding Rates, and Long-Short Ratios reveal the hidden dynamics of the battlefield.
Here's your takeaway:
- Don't trade blindly on charts.
- Watch where money is flowing (OI).
- Track who's paying who (Funding).
- Gauge herd psychology (Long-Short Ratios).
- Use tools like Coinglass, Bybit Data Center, and Bitget Market Data to track them in real time.
Blend these three, and you'll see opportunities most traders miss. That's real alpha.
✅ Action Step
Next time you're about to enter a trade on Bybit or Bitget, open their data dashboards. Compare Open Interest, Funding Rates, and Long-Short Ratios before you click that buy or sell button. Ask: Am I trading with the crowd, or ahead of it?
When you start trading this way, you'll stop following the herd… and start front-running it.
Further Reading and Resources
Ready to take your trading to the next level? Our professional risk management software helps you combine these advanced market metrics with proper position sizing and risk management. Try it today and trade with confidence.