How to Use Heikin Ashi: Complete Trading Tutorial & Formula Guide
How to Use Heikin Ashi: Complete Trading Tutorial & Formula Guide
Master how to use Heikin Ashi with our comprehensive tutorial covering the formula, trend identification, and proven trading strategies.
Learning how to use Heikin Ashi is essential for any trader looking to master trend identification and reduce market noise. This comprehensive Heikin Ashi tutorial will teach you everything from the basic formula to advanced trading strategies that professional traders use to identify profitable trend opportunities and manage risk effectively.
A Brief History of the Heikin Ashi Indicator
Heikin‑Ashi (平衡足), literally meaning "average bar" in Japanese, traces back to the 1700s and Japanese rice trader Munehisa Homma, the originator of standard candlestick charts. It evolved to filter noise from price data by averaging current and past periods, making trends clearer and more reliable.
The indicator was developed to address the main limitation of traditional candlestick charts: their susceptibility to market noise and false signals. By smoothing price data through averaging, Heikin Ashi provides a cleaner view of market trends that's easier to interpret and trade.
Heikin Ashi Formula Explained
To calculate Heikin Ashi candles – essential for anyone searching "Heikin Ashi formula explained":
Core Heikin Ashi Formulas:
haClose = (Open + High + Low + Close) ÷ 4
haOpen = (previous haOpen + previous haClose) ÷ 2
haHigh = max(High, haOpen, haClose)
haLow = min(Low, haOpen, haClose)
These formulas smooth price fluctuations by blending periodic averages and are central to reducing market noise. The key difference from traditional candlesticks is that each Heikin Ashi candle uses data from the previous candle, creating a continuous smoothing effect.
Why the Formula Works:
- haClose: Uses the typical price (average of OHLC) instead of just the closing price
- haOpen: Creates continuity by averaging the previous candle's open and close
- haHigh/haLow: Ensures the high and low reflect the true range including the calculated values
Why Use Heikin Ashi?
Heikin‑Ashi charts significantly reduce short‑term volatility compared to regular candlesticks, making trend direction and strength easier to interpret. Research shows Heikin‑Ashi improves next‑day trend‑prediction success rates to roughly 72% vs. 49% for raw OHLC data, with confidence levels up to 95% in backtests across Dow Jones stocks.
Key Benefits:
- Reduced Market Noise: Eliminates false signals from short-term price fluctuations
- Clearer Trend Identification: Trend direction is immediately visible through candle color and shadow patterns
- Better Entry/Exit Timing: Provides more reliable signals for trade entries and exits
- Improved Risk Management: Smoother price action makes it easier to set appropriate stop losses
How to Read Heikin Ashi Candles: Trading Strategy
If you're looking for "how to use Heikin Ashi" effectively, follow this simple yet effective trend‑trading method to read Heikin Ashi candles:
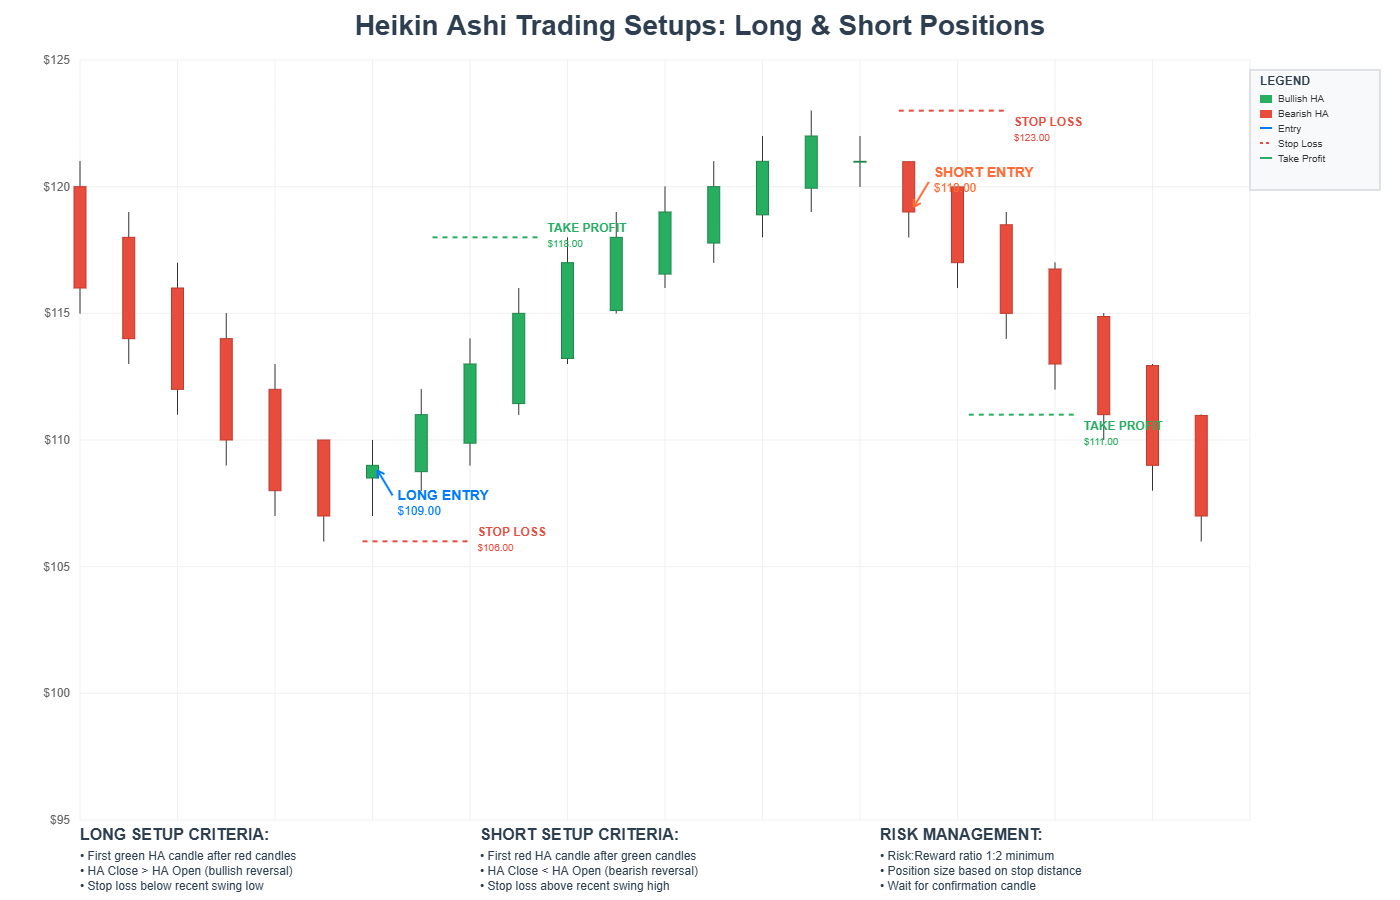
Visual guide showing Heikin Ashi trading setups with entry points, stop losses, and take profit levels for both long and short positions.
Step 1: Identify the Trend
Strong Uptrend Signals:
- A series of green (or white) Heikin‑Ashi candles with little or no lower shadow
- Consistent green candles indicate sustained buying pressure
- Small or absent lower shadows show minimal selling pressure
Strong Downtrend Signals:
- Red candles with no upper shadow indicate a strong downtrend
- Consistent red candles show sustained selling pressure
- Small or absent upper shadows indicate minimal buying pressure
Step 2: Entry Rules
Long Entry Conditions:
- Go long when green HA candles form consecutively and shadows diminish
- Look for at least 2-3 consecutive green candles
- Ensure lower shadows are small or non-existent
Short Entry Conditions:
- Go short when red candles dominate with no upper wicks
- Look for at least 2-3 consecutive red candles
- Ensure upper shadows are small or non-existent
Step 3: Exit Strategy
Exit when the candle color changes or indecision candles with long wicks appear—often a signal of trend pause or reversal. Key exit signals include:
- Color Change: When a green candle becomes red (or vice versa)
- Long Shadows: Indecision candles with long upper or lower shadows
- Doji Patterns: Small-bodied candles indicating market indecision
Step 4: Trailing Stops
Because Heikin Ashi smooths price, use a trailing stop or moving average (e.g. 9‑period or 21‑period MA) to ride longer trends securely. This helps you:
- Lock in profits as the trend continues
- Exit quickly when the trend reverses
- Avoid premature exits due to minor price fluctuations
Heikin Ashi vs Regular Candles: Complementary Indicators
Understanding Heikin Ashi vs regular candles helps you choose the best complementary indicators. Common accompaniments include:
1. Average Directional Index (ADX) or Directional Movement Index (DMI)
- Purpose: Helps confirm trend strength
- Usage: Enter trades only when ADX > 20 and rising
- Benefits: Filters out weak trends and confirms strong directional movement
2. Simple or Exponential Moving Averages
- Recommended Periods: 9, 21, 50-period
- Purpose: For trend confirmation and trailing stops
- Usage: Use as dynamic support/resistance levels
3. RSI or Volume/Momentum Indicators
- Purpose: Use RSI to detect overbought/oversold conditions
- Usage: Confirm strength or exhaustion in the trend
- Benefits: Helps avoid entering trades at extreme levels
4. Bollinger Bands or Keltner Channels
- Purpose: Useful for spotting expansion or contraction phases
- Usage: Align with HA trend signals for confirmation
- Benefits: Provides additional context for market volatility
Advanced Heikin Ashi Trading Techniques
1. Multiple Timeframe Analysis
- Use Heikin Ashi on higher timeframes (4H, Daily) for trend direction
- Use lower timeframes (1H, 15M) for entry timing
- Ensures alignment between trend and entry signals
2. Volume Confirmation
- Combine Heikin Ashi signals with volume analysis
- Higher volume on trend-confirming candles increases signal reliability
- Low volume on reversal candles may indicate false signals
3. Support and Resistance Integration
- Use traditional support/resistance levels with Heikin Ashi
- Enter trades when HA signals align with key levels
- Improves entry accuracy and risk/reward ratios
Common Mistakes to Avoid
1. Using Heikin Ashi Alone
- Heikin Ashi shouldn't be used alone—it hides true open/close prices and lacks price gaps
- Always combine with other technical indicators for confirmation
2. Ignoring Market Context
- Don't trade against the overall market trend
- Consider fundamental factors and market sentiment
- Use multiple timeframes for context
3. Overlooking Risk Management
- Always use proper position sizing
- Set appropriate stop losses based on volatility
- Don't risk more than 1-2% of your account per trade
Final Thoughts
The Heikin Ashi indicator offers one of the cleanest visualizations of market trends by averaging price data and suppressing noise. For traders targeting long‑tail keyword intents like "Heikin Ashi strategy with ADX confirmation" or "Heikin Ashi entry exit rules", the approach is straightforward: identify trend via HA color and shadows, confirm momentum via ADX/MA/RSI, and manage entry/exit through candle change or trailing stops.
Heikin Ashi shouldn't be used alone—it hides true open/close prices and lacks price gaps—but paired with trend‑strength indicators, it becomes a powerful tool for swing and position traders seeking disciplined trend engagement.
Key Takeaways:
- Heikin Ashi provides cleaner trend identification than traditional candlesticks
- Combine with other indicators like ADX, RSI, and moving averages for best results
- Use proper risk management with trailing stops and position sizing
- Multiple timeframe analysis improves signal reliability
- Volume confirmation increases the probability of successful trades
Start incorporating the Heikin Ashi indicator into your trading strategy today and experience the difference that cleaner trend identification can make in your trading performance.
Ready to take your trading to the next level? Download our position size calculator to complement your Heikin Ashi analysis with advanced risk management tools.