How to Use Bollinger Bands: Complete Trading Guide & Formula Explained
Bollinger Bands Trading Strategy: Master Volatility-Based Market Analysis
Master the Bollinger Bands trading strategy with proven formulas, entry signals, and risk management techniques for volatility-based trading success.
Learning how to use Bollinger Bands is essential for any trader looking to master volatility-based market analysis. This comprehensive Bollinger Bands tutorial will teach you everything from the basic formula to advanced trading strategies that professional traders use to identify profitable opportunities and manage risk effectively.
The Revolutionary Origins of Bollinger Bands Formula
John Bollinger developed Bollinger Bands in the early 1980s while trading options, with the indicator being introduced in 1983. At the time, Bollinger was trading options and much of his analytics involved volatility, leading him to move beyond the fixed-width trading bands that were commonly used.
According to Bollinger, his namesake indicator was designed to provide insights into market conditions by combining the concepts of a moving average and a volatility measure in one indicator. The innovation addressed a critical limitation in traditional technical analysis: the inability to adapt to changing market volatility conditions automatically.
How to Read Bollinger Bands Chart: Understanding the Formula
The Bollinger Bands formula consists of three distinct components that work together to create a dynamic volatility channel. Understanding how to read Bollinger Bands chart is crucial for successful trading:
Core Bollinger Bands Formulas:
Middle Band (Simple Moving Average):
Middle Band = SMA(Close, n)
Where n = period (typically 20)
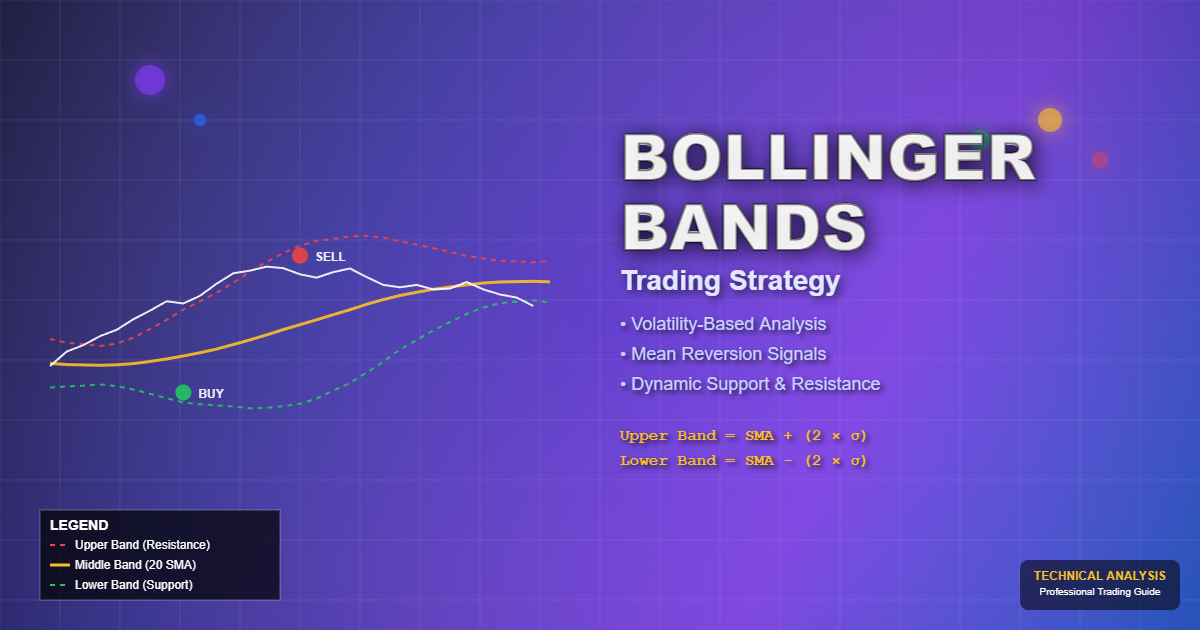
Upper Band (Resistance Level):
Upper Band = SMA(Close, n) + (k × Standard Deviation)
Lower Band (Support Level):
Lower Band = SMA(Close, n) - (k × Standard Deviation)
Standard Deviation Calculation:
σ = √[Σ(Close - SMA)² / n]
Where:
- SMA = Simple Moving Average
- n = Number of periods (default: 20)
- k = Standard deviation multiplier (default: 2)
- σ = Standard deviation of closing prices
The outer Bollinger Bands are 2 standard deviations away from the mean, which means if the price is in the lower band, it's considered "cheap," and if it's in the upper band, it's considered "expensive". This mathematical relationship creates approximately 95% price containment within the bands under normal distribution conditions.
Why the Formula Works:
- Dynamic Adaptation: Bands automatically adjust to market volatility
- Statistical Foundation: Based on standard deviation for reliable probability analysis
- Trend Integration: Middle band provides trend direction while outer bands show extremes
- Volatility Measurement: Band width directly reflects market volatility levels
Bollinger Bands Trading Signals: How to Use Bollinger Bands
If you're looking for "how to use Bollinger Bands" effectively, follow this comprehensive approach to identify Bollinger Bands trading signals:
Signal Interpretation and Entry Criteria
Bullish Signals:
- Price touches or breaks below the lower band, indicating oversold conditions
- Bollinger Band squeeze followed by expansion with upward price movement
- Price rejection at the lower band with strong bullish candlestick patterns
- Middle band acts as dynamic support during uptrends
Bearish Signals:
- Price reaches or exceeds the upper band, signaling overbought territory
- Band contraction followed by expansion with downward price momentum
- Failed breakout above upper band with reversal confirmation
- Middle band acts as dynamic resistance during downtrends
Optimal Timeframe Selection
The Bollinger Bands tutorial shows this indicator performs exceptionally well across multiple timeframes:
- Scalping: 1-5 minute charts for rapid mean reversion plays
- Day Trading: 15-30 minute charts for intraday volatility breakouts
- Swing Trading: 4-hour to daily charts for trend continuation setups
- Position Trading: Weekly charts for major volatility expansion patterns
Risk Management Framework
Position Sizing Rules:
- Risk 1-2% of account per trade based on band width
- Wider bands = smaller position sizes due to increased volatility
- Narrower bands = potential for larger positions with tighter stops
Stop Loss Placement:
- Long positions: Place stops 10-20 pips below the lower band
- Short positions: Set stops 10-20 pips above the upper band
- Adjust stop distance based on Average True Range (ATR)
Common Trading Mistakes to Avoid:
- Trading against strong trends using only band touches
- Ignoring volume confirmation during breakout signals
- Using default settings without considering market volatility characteristics
Powerful Bollinger Bands Complementary Indicators
Want to rank for "Bollinger Bands complementary indicators"? Here are the most effective combinations:
RSI Combination Strategy
Multi-timeframe analysis incorporating Bollinger Bands and RSI indicator captures trend direction by identifying reversal points through band breakouts combined with RSI overbought/oversold signals. This pairing works because:
- RSI confirms momentum divergence at band extremes
- Oversold RSI + lower band touch = high-probability long setup
- Overbought RSI + upper band rejection = reliable short opportunity
For a deeper dive into RSI strategies, check out our comprehensive guide on RSI trading techniques and momentum analysis.
Volume-Weighted Integration
Combining Bollinger Bands with volume indicators enhances signal reliability:
- Volume Spike + Band Breakout: Confirms genuine breakout vs. false signal
- Low Volume + Band Touch: Indicates weak momentum, favoring reversal plays
- Volume Divergence: Early warning system for potential trend changes
Moving Average Convergence Setup
Use additional moving averages to filter Bollinger Bands signals:
- 50 EMA above/below middle band confirms trend direction
- Price above middle band + 50 EMA support = bullish bias maintained
- Middle band slope alignment with longer-term MA validates trend strength
Learn more about moving average strategies in our guide on moving average trading techniques.
Advanced Bollinger Bands Trading Techniques
1. Bollinger Band Squeeze Strategy
The Bollinger Band squeeze occurs when bands contract, indicating low volatility and potential for explosive moves:
- Squeeze Identification: Bands narrow to 20-30% of normal width
- Breakout Confirmation: Wait for price to break above/below bands with volume
- Target Setting: Measure the squeeze width and project it as breakout distance
BOLLINGER BAND SQUEEZE
Breakout Trading Strategy
🎯 SETUP: Wait for bands to contract (squeeze) then trade the breakout direction
LONG POSITION
SHORT POSITION
📋 TRADING RULES
2. Mean Reversion vs. Trend Following
Mean Reversion Strategy:
- Enter when price touches outer bands
- Target the middle band for profit taking
- Use in sideways or ranging markets
Trend Following Strategy:
- Enter on band breakouts with momentum
- Ride the trend until bands contract
- Use in trending markets with clear direction
3. Multiple Timeframe Bollinger Bands Analysis
- Higher Timeframe: Use for trend direction and major support/resistance
- Lower Timeframe: Use for precise entry and exit timing
- Alignment: Enter trades when both timeframes show favorable conditions
Bollinger Bands for Different Market Conditions
Trending Markets
In strong trending markets, Bollinger Bands can help identify:
- Trend Continuation: Price riding along the upper or lower band
- Pullback Entries: Price returning to the middle band before continuing
- Trend Exhaustion: Price breaking through bands with momentum loss
Ranging Markets
In sideways markets, Bollinger Bands trading strategy excels at:
- Range Boundaries: Upper and lower bands define trading range
- Mean Reversion: Price oscillating between bands
- Breakout Preparation: Bands contracting before range expansion
Volatile Markets
During high volatility periods:
- Band Expansion: Wider bands accommodate increased price movement
- False Breakouts: More frequent but shorter-lived band penetrations
- Risk Adjustment: Larger stop losses required due to increased volatility
Limitations and Market Considerations
While Bollinger Bands offer insights into potential price reversals and overbought/oversold conditions, traders should recognize key limitations:
Key Limitations:
- False Signals in Strong Trends: Price can "walk" along bands during powerful moves
- Lag in Fast Markets: Standard 20-period setting may lag in volatile conditions
- Market-Specific Settings: Default settings may not suit all asset classes
- Volume Dependency: Signals are more reliable with volume confirmation
Market Adaptations:
- Forex Markets: Consider 15-period setting for faster response
- Crypto Markets: Use 25-period setting for reduced noise
- Stock Markets: Default 20-period works well for most equities
- Commodity Markets: Adjust multiplier to 2.5 for wider bands
Risk Management and Position Sizing
Essential Risk Management Rules:
- Never Risk More Than 2% of your account on any single trade
- Use Band Width for Position Sizing: Wider bands = smaller positions
- Set Stop Losses Beyond Bands: Account for normal price fluctuations
- Monitor Correlation: Avoid multiple positions in correlated assets
Advanced Risk Techniques:
- Trailing Stops: Move stops to middle band as trade progresses
- Partial Profit Taking: Close portion at middle band, let remainder run
- Correlation Analysis: Avoid overexposure to similar market movements
For comprehensive risk management strategies, explore our position size calculator and risk management guide.
Next Steps: Implementing Your Bollinger Bands Trading Plan
Begin by backtesting the Bollinger Bands strategy on your preferred instruments using historical data to validate performance. Start with paper trading to refine your signal interpretation skills before risking real capital.
Implementation Checklist:
- Choose Your Timeframe: Start with 4-hour charts for swing trading
- Set Up Your Charts: Add Bollinger Bands with 20-period, 2-standard deviation
- Add Complementary Indicators: RSI, volume, and moving averages
- Define Your Rules: Clear entry, exit, and risk management criteria
- Paper Trade First: Practice without real money for at least 30 trades
- Track Performance: Monitor win rate, risk-reward ratio, and drawdown
Recommended Tools:
- Charting Platform: Use platforms with customizable Bollinger Bands
- Backtesting Software: Test strategies on historical data
- Risk Calculator: Use our position size calculator for proper sizing
- Journal: Track all trades and analyze performance patterns
Final Thoughts
The Bollinger Bands trading strategy offers one of the most versatile approaches to market analysis, combining mathematical precision with practical trading applications. By understanding the formula, mastering signal interpretation, and implementing proper risk management, traders can harness the power of volatility-based analysis for consistent profits.
Bollinger Bands shouldn't be used alone—combine them with complementary indicators like RSI, volume analysis, and moving averages for the best results. Remember that successful trading requires discipline, proper risk management, and continuous learning.
Key Takeaways:
- Bollinger Bands provide dynamic support and resistance levels based on volatility
- Combine with other indicators like RSI and volume for enhanced signals
- Adapt settings to different markets and timeframes
- Use proper risk management with position sizing based on band width
- Practice extensively before trading with real capital
Start incorporating the Bollinger Bands trading strategy into your analysis today and experience the difference that volatility-based trading can make in your performance.
Ready to take your trading to the next level? Download our position size calculator to complement your Bollinger Bands analysis with advanced risk management tools.