Get Ahead of the Market Using Elder-Ray Index
Get Ahead of the Market Using Elder-Ray Index
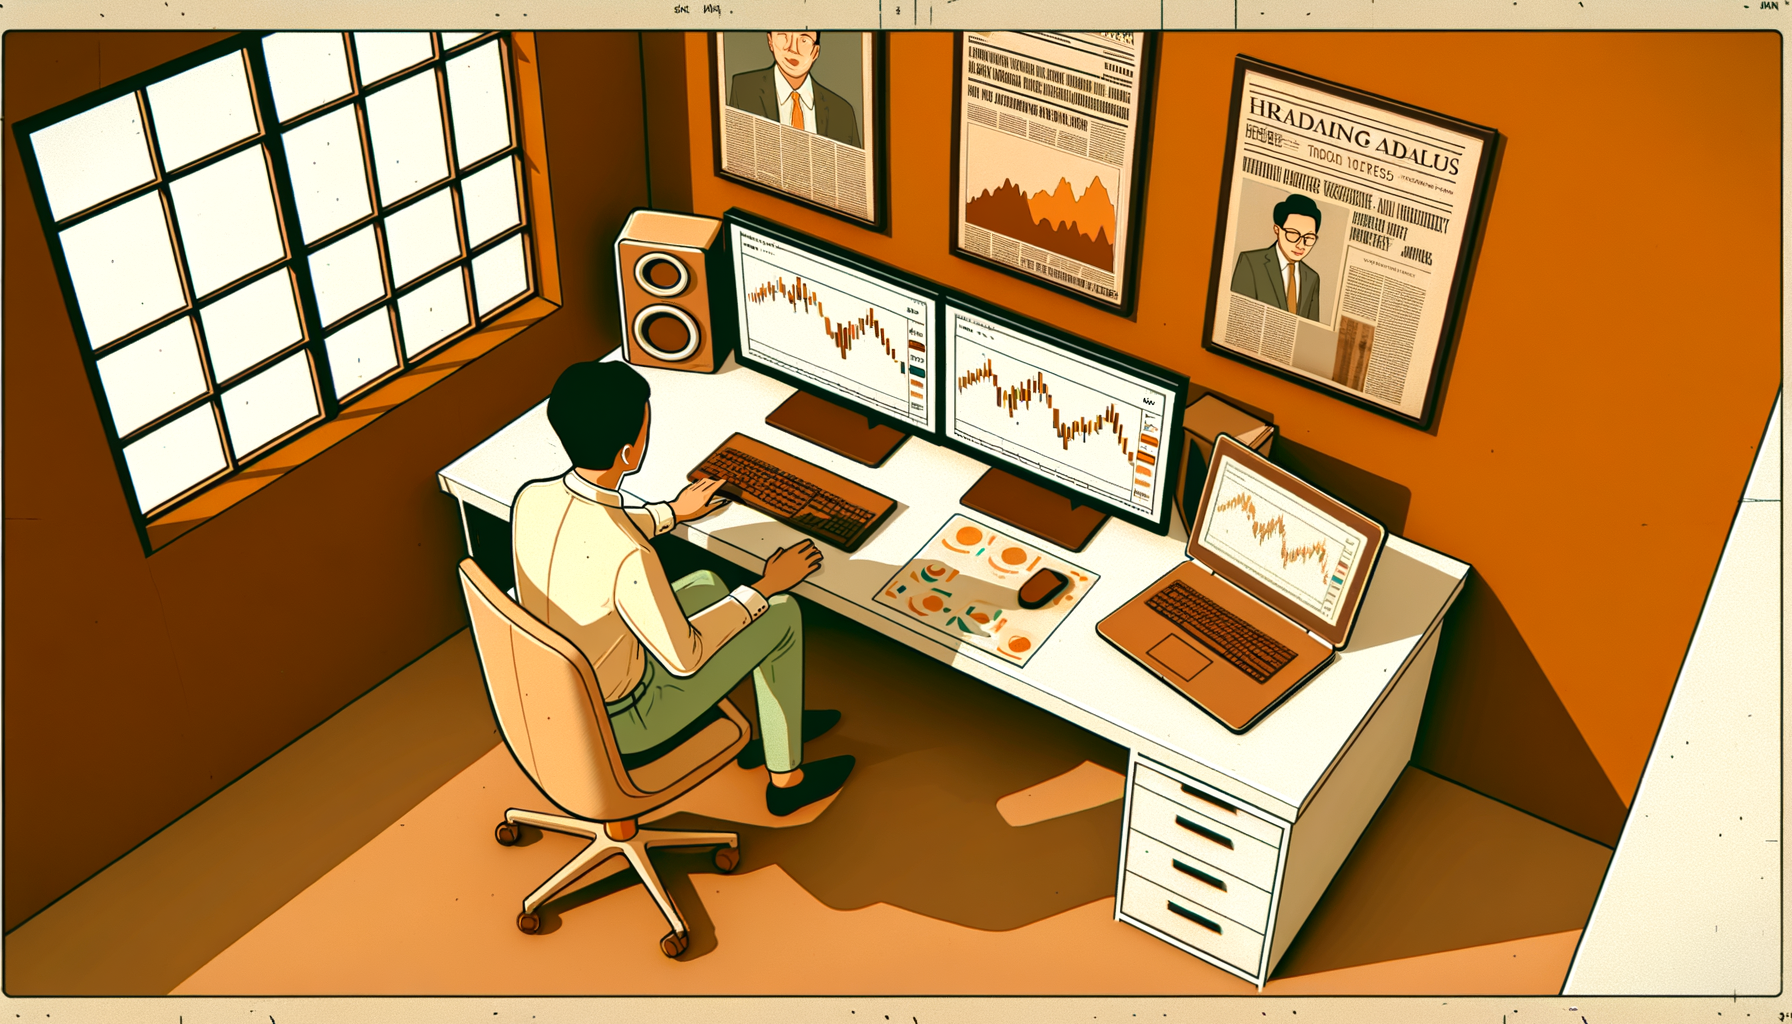
Some call the Elder-Ray Index a hidden gem. We call it essential. Discover how it can sharpen your trading edge instantly. The Elder Ray indicator is a vital tool in the arsenal of many traders, offering insight into market trends and potential reversals. It combines the power of bulls and bears, giving a comprehensive view of market pressures. In this comprehensive guide, we'll delve into how the Elder Ray can enhance your trading strategies, particularly when used on platforms like TradingView.
Table of Contents
- What is the Elder Ray Indicator?
- History & Development of Alexander Elder Ray
- How to Calculate the Elder Ray Indicator
- Components of the Elder Ray Chart
- Elder Ray Index Strategy and Trading Styles
- Practical Examples of Elder Ray Application
- Common Mistakes and How to Avoid Them
- Elder Ray vs Other Indicators
- Best Practices for Using the Elder Ray Indicator
- FAQ
- Conclusion
What is the Elder Ray Indicator?
The Elder Ray indicator is a powerful tool used by traders to measure the buying and selling pressure within the market. It consists of two main components: the Bull Power and Bear Power, which are derived from an Exponential Moving Average (EMA). By analyzing these pressures, traders can identify potential reversals and trend continuations. This indicator is particularly useful in volatile markets where quick decision-making is crucial.
History & Development of Alexander Elder Ray
The Elder Ray indicator was developed by Alexander Elder, a renowned trader and psychologist. Introduced in his book, Trading for a Living in the 1990s, the Elder Ray was designed to assess the power dynamics between bulls and bears in the market. Over the years, it has evolved and adapted, remaining a staple in many traders' toolkits due to its ability to provide clear insights into market conditions.
How to Calculate the Elder Ray Indicator
Understanding the elder ray calculation formula is essential for effectively using this indicator. The calculation involves:
- Exponential Moving Average (EMA): Calculate the EMA of the chosen period as the baseline.
- Bull Power: Subtract the EMA from the day's high.
- Bear Power: Subtract the day's low from the EMA.
These calculations can be simplified using an elder ray calculator available on trading platforms like TradingView, which automates the process and allows for real-time analysis.
Components of the Elder Ray Chart
The elder ray chart visually represents the Bull and Bear Power. It typically features:
- Bull Power Bar: Above the zero line, indicating buying strength.
- Bear Power Bar: Below the zero line, indicating selling strength.
By observing these bars, traders can gauge market sentiment and potentially spot reversals or confirm trends.
Elder Ray Index Strategy and Trading Styles
Elder Ray Scalping Strategy
For scalpers, the elder ray scalping strategy is invaluable. When trading on short timeframes, such as 1-minute or 5-minute charts, the Elder Ray helps identify quick entry and exit points by highlighting shifts in buying and selling pressure.
Elder Ray Day Trading
In elder ray day trading, traders rely on the indicator to manage positions within a single trading day. By using shorter periods for the EMA, day traders can capture intraday signals and optimize their entries and exits.
Elder Ray Swing Trading
Elder ray swing trading involves holding positions over several days. By using the Elder Ray to confirm trends, swing traders can maximize profit potential from sustained market movements. The indicator helps in identifying strong trend directions and potential reversal points.
Elder Ray Trend Following
For trend followers, the elder ray trend following approach is particularly effective. By analyzing the long-term direction of Bull and Bear Power, traders can align their strategies with the prevailing market trend, increasing the likelihood of capturing significant moves.
Practical Examples of Elder Ray Application
Consider a scenario where a trader uses the Elder Ray on a daily chart. Suppose the Bull Power consistently rises above the Bear Power, indicating a bullish trend. The trader might enter a long position, setting a stop-loss just below the recent low to manage risk effectively.
In another example, if the Bear Power suddenly spikes, it could signal a potential market reversal, prompting the trader to exit any long positions or consider shorting the asset.
Common Mistakes and How to Avoid Them
Using the Elder Ray without additional confirmation can lead to elder ray false signals. Traders should combine it with other indicators like the Moving Average Convergence Divergence (MACD) or Relative Strength Index (RSI) to validate signals. Another common error is misinterpreting the indicator's signals due to incorrect settings—adjusting the periods to match the trading timeframe can prevent such issues.
Elder Ray vs Other Indicators
Elder Ray vs
The Elder Ray indicator is unique in its ability to separately measure buying and selling pressure, unlike other indicators that may only provide a single trend direction. This dual measurement can offer a more nuanced view of market dynamics.
Elder Ray vs Other Indicators
Comparing Elder Ray vs other indicators, the Elder Ray stands out for its simplicity and effectiveness in volatile markets. While indicators like the Bollinger Bands offer insight into volatility and range, the Elder Ray focuses on the underlying power dynamics, making it a valuable complement in a trader's toolkit.
Best Practices for Using the Elder Ray Indicator
To maximize the effectiveness of the Elder Ray, follow these best practices:
- Combine with Other Indicators: Use it alongside other technical tools for confirmation.
- Adjust Settings Appropriately: Tailor the EMA period to your specific trading style and timeframe.
- Practice on Demo Accounts: Especially for beginners, using the Elder Ray in a risk-free environment helps build confidence and understanding.
FAQ
What is Elder Ray?
The Elder Ray measures buying and selling pressure in the market. It consists of two components: Bull Power and Bear Power, derived from an Exponential Moving Average (EMA). This allows traders to gauge the strength of market trends and potential reversals.
How to use an Elder Ray indicator?
To use the Elder Ray, calculate the EMA over your chosen period, then determine Bull and Bear Power by comparing the day's highs and lows to the EMA. This helps identify trends and potential entry/exit points.
What is the 5 3 1 rule in trading?
The 5-3-1 rule is a trading strategy that guides beginners in selecting currency pairs, trading times, and a specific trading strategy, helping to reduce overwhelm and focus on consistent practice.
What is the 3 5 7 rule in trading?
The 3-5-7 rule is a risk management strategy in trading, limiting risk to 3% per trade, capping total exposure at 5% at any one time, and using a 7% drawdown limit to protect capital.
How do you use elder ray in trading?
Traders use the Elder Ray to identify trend directions, potential entry and exit points, and to gauge market volatility. By analyzing Bull and Bear Power, traders can make more informed decisions.
What are the best settings for elder ray?
Optimal settings for Elder Ray depend on your trading timeframe. Day traders might prefer shorter EMAs for quick signals, while swing traders may use longer EMAs for trend confirmation.
Is elder ray profitable?
The profitability of Elder Ray depends on its proper usage, risk management, and market conditions. It's crucial to use it in conjunction with other indicators and a sound trading strategy.
What are the limitations of elder ray?
Elder Ray's limitations include lagging signals in rapidly changing markets and potential false breakouts. It's best used alongside other indicators for confirmation.
How accurate is elder ray?
The accuracy of Elder Ray varies based on market conditions and how it's combined with other analysis tools. It's effective for identifying trends but should not be used in isolation.
Can beginners use elder ray?
Yes, beginners can use Elder Ray, but they should start with a demo account to understand its signals and integrate it into a broader trading strategy.
What timeframe works best with elder ray?
Elder Ray works across various timeframes, from 1-minute charts for scalping to daily charts for swing trading. The best timeframe depends on your trading style.
How does elder ray compare to other indicators?
Elder Ray uniquely measures separate buying and selling pressures, unlike other indicators that might provide a single trend signal. This can offer a distinct advantage in understanding market dynamics.
What are common mistakes when using elder ray?
Common mistakes include relying solely on Elder Ray without confirmation, using incorrect settings, and ignoring broader market context. Combining it with other indicators can mitigate these issues.
Conclusion
The Elder Ray indicator is a versatile tool that, when used correctly, can provide significant insights into market dynamics and potential trading opportunities. Whether you're scalping, day trading, or swing trading, understanding the nuances of Bull and Bear Power can enhance your trading decisions. Remember, combining Elder Ray with other indicators and practicing on platforms like TradingView can amplify its effectiveness. As with any trading strategy, continuous learning and adaptation are key to long-term success.